My dad has trace Native American (NA)DNA in every ethnicity test I run his DNA through, from AncestryDNA to all the admixture tests on GEDmatch.
Why? Where is it coming from?
My dad has no Cherokee, Iroquois, or Dakota ancestor story. I have found no records whatsoever indicating Native American heritage. A full half of his ancestry came from Scandinavian in the 1880's and 1890's, for pete's sake.
And is the Native American real? That is not clear to me. I'm somewhat inclined to dismiss it because of a lack of all usual evidence, but why is it showing up at all? It is a distinct DNA signature, due to the isolation of Native Americans for thousands of years. Since the NA comes across as Arctic whenever it is possible to refine (as opposed to North American, Mesoamerican, or South American), I have wondered for a while if my Scandinavian ancestors are the culprits for this DNA?
Everything else about his DNA test results makes perfect sense. An English/Scottish/Welsh type with a heavy dose of Scandinavian, and some Irish and some German. In AncestryDNA's breakdown he also has possible trace Europe East, European Jewish, Finland/Northwest Russia, and Caucasus. None of those surprise me, as those groups all inhabited the same landmass, and in the past 500 - 1000 years have had interaction. That my dad should have as strong an indicator for Native American as Finland/Northwest Russia is very odd. I would expect the latter to be the larger, more dominant trace ethnicity. And while the GEDmatch battery of ethnicity admixture tests indeed show a larger amount of eastern Scandinavia and Russia than Ancestry's prediction, the Native American keeps pace, hovering either slightly less or slightly more than 1%. An annoying number, by the way, as that is at what is called "noise level."
© 2014 Copyright, Christine Manczuk, All Rights Reserved.
Showing posts sorted by relevance for query native american. Sort by date Show all posts
Showing posts sorted by relevance for query native american. Sort by date Show all posts
Monday, November 17, 2014

Saturday, February 18, 2017
My Dad's Perplexing Minor Native American DNA: Percentage by Chromosome
 |
| Ugh, the less than 1 percent Native American is so frustrating. Why is it there?? |
There are some on GEDmatch who consider Eurogenes K36 as a good indicator of any real Native American DNA. My father has an infuriatingly small amount of such DNA on this test, as with most of the ethnicity tests.
Eurogenes K36 as Amerindian 0.23%
I decided today to check out where Native American DNA resides by Chromosome (which you can conveniently do on GEDmatch).
Eurogenes K36 by Chromosome over 1 percent
Chromosome 4 (2.7%)
Chromosome 12 (2.7%)
Chromosome 18 (1.9%)
compared to other readings:
Eurogenes K13 by Chromosome over 1 percent
Chromosome 4 (1.5%)
Chromosome 6 (3.6%)
Chromosome 9 (1.4%)
Chromosome 12 (4.3%)
Chromosome 15 (1.5%)
Eurogenes EUtest V2 K15 by Chromosome over 1 percent
Chromosome 2 (2%)
Chromosome 6 (2.7%)
Chromosome 12 (3.6%)
Chromosome 15 (1.5%)
Dodecad World 9 by Chromosome over 1 percent
Chromosome 1 (1.3%)
Chromosome 2 (1.5%)
Chromosome 4 (2.4%)
Chromosome 6 (3.8%)
Chromosome 8 (1.7%)
Chromosome 12 (6.2%)
Chromosome 18 (2.3%)
Chromosome 22 (1.4%)
MDLP World-22 by Chromosome over 1 percent (combined Mesoamerican/Arctic-American/South-America Amerind)
Chromosome 1 (1.8%)
Chromosome 4 (1.7%)
Chromosome 6 (1.5%)
Chromosome 7 (4.0%)
Chromosome 12 (3.7%)
Chromosome 15 (4.1%)
Chromosome 16 (1.5%)
Chromosome 18 (2.6%)
Chromosome 22 (2.1%)
puntDNAL K15 by Chromosome over 1 percent
Chromosome 2 (1.2%)
Chromosome 6 (1.5%)
Chromosome 12 (1.3%)
Chromosome 18 (3.9%)
Chromosome 22 (2.5%)
Eurasia K14 by Chromosome over 1 percent (combined N Amerindian/S Amerindian)
Chromosome 2 (2.2%)
Chromosome 4 (3.4%)
Chromosome 5 (4.5%)
Chromosome 6 (1.1%)
Chromosome 8 (4.2%)
Chromosome 9 (4.2%)
Chromosome 11 (7.4%)
Chromosome 12 (4.8%)
Chromosome 13 (6.5%)
Chromosome 14 (2.9%)
Chromosome 16 (2.5%)
Chromosome 17 (7.8%)
Chromosome 18 (9.7%)
Chromosome 19 (10%)
I notice that Chromosome 12 always has some Native American. Chromosomes 6 and 18 usually come up as well. I wonder what I can now do with that information?
© 2017 Copyright, Christine Manczuk, All Rights Reserved.
Tuesday, November 18, 2014
Where is this Native American DNA coming from? Part 2
I tested my dad's DNA at Ancestry.com. I then uploaded the raw DNA results to GEDmatch to play around some more. Here is what I found.
The following is my father's predicted ethnicity percentages (with ranges) from AncestryDNA (Ancestry.com's DNA). I have included only those populations that either has definite DNA affinity with, or may have trace affinity with.
NOTE: Ancestry explains Trace Regions this way: "These are regions where you seem to have just a trace amount of genetic ethnicity -- there is only a small amount of evidence supporting the regions as part of your genetic ethnicity. Because both the estimated amount and the range of the estimate are small, it is possible that these regions appear by chance and are not actually part of your genetic ethnicity." [emphasis mine]
Region Approximate amount
America less than 1%
Native American less than 1% (Range: 0%-1%)
Asia 0%
Asia South 0% (Range: 0%-1%)
Europe 99%
Great Britain 62% (Range: 38%-85%)
Scandinavia 33% (Range: 12%-53%)
Ireland 2% (Range: 0%-10%)
Europe West 2% (Range: 0%-9%)
Europe East 0% (Range: 0%-2%)
European Jewish 0% (Range: 0%-less than 1%)
Finland/NWRussia 0% (Range: 0%-1%)
West Asia 0%
Middle East 0% (Range: 0%-1%)
Caucasus 0% (Range: 0%-less than 1%)
So far, so good. All of the predicted ethnicities seemed reasonable from what I knew, except the Native American. My own results included Native American 0% (Range: 0%-less than 1%). I was to find that most of my NA amounts in other ethnicity admixture tests on GEDmatch would show about half whatever my father's NA amounts were.
Here are the results from the various GEDmatch tests. I will highlight any Native American as well as Siberian and Oceanian, as they may (or may not) be relevant.
Eurogenes EUtest V2 K15
Population
North_Sea 36.44%
Atlantic 24.37%
Baltic 11.87%
Eastern_Euro 12.45%
West_Med 8.01%
West_Asian 4.52%
East_Med 0.08%
Red_Sea -
South_Asian -
Southeast_Asian -
Siberian 0.67%
Amerindian 0.81%
Oceanian 0.43%
Northeast_African -
Sub-Saharan 0.35%
Eurogenes Hunter Gatherer vs Farmer
Population
Anatolian Farmer 9.59%
Baltic Hunter Gatherer 57.12%
Middle Eastern Herder -
East Asian Farmer -
South American Hunter Gatherer 1.33%
South Asian Hunter Gatherer 0.90%
North Eurasian Hunter Gatherer 0.57%
East African Pastoralist -
Oceanian Hunter Gatherer 0.11%
Mediterranean Farmer 30.05%
Pygmy Hunter Gatherer -
Bantu Farmer 0.33%
Eurogenes K9
Population
South Asian 0.65%
Caucasus 7.00%
Southwest Asian -
North Amerindian + Arctic 1.30%
Siberian 0.85%
Mediterranean 23.72%
East Asian -
West African 0.17%
North European 66.31%
Eurogenes K10
Population
South Asian 0.57%
Caucasus 7.17%
Southwest Asian -
North Amerindian + Arctic 1.27%
Siberian 0.71%
Mediterranean 13.00%
East Asian -
West African 0.15%
East European 24.69%
North Atlantic 52.44%
Eurogenes K11
Population
South Asian 0.30%
Caucasus 6.35%
Southwest Asian -
North Amerindian + Arctic 1.19%
Siberian -
Mediterranean 12.31%
East Asian -
West African 0.11%
Volga-Ural 12.79%
South Baltic 16.45%
North Atlantic 50.49%
Eurogenes K12
Population
South Asian 0.22%
Caucasus 5.97%
Southwest Asian -
North Amerindian + Arctic 1.18%
Siberian -
Mediterranean 10.96%
East Asian -
West African 0.09%
Volga-Ural 11.35%
South Baltic 13.03%
Western European 27.18%
North Sea 30.02%
Eurogenes K13
Population
North_Atlantic 44.91%
Baltic 28.77%
West_Med 12.34%
West_Asian 6.86%
East_Med 3.16%
Red_Sea 0.05%
South_Asian 0.33%
East_Asian -
Siberian 1.33%
Amerindian 1.08%
Oceanian 0.67%
Northeast_African -
Sub-Saharan 0.49%
MDLP Ancient Roots K18
Population
Caucasian 6.66%
Melano-Austronesian 0.23%
Volga-Uralic 6.27%
East_Siberian -
West_Siberian 2.13%
South_Central_Asian 4.20%
South_Indian 0.70%
North_West_European 33.43%
Sami-Finnic 2.47%
South_East_Asian -
Archaic_African 0.61%
Mediterranean 8.21%
Arctic -
Afroasiatic 1.78%
East_European 30.29%
Roma 1.51%
East_African -
Amerindian 1.54%
MDLP World-22
Population
Pygmy -
West-Asian 6.41%
North-European-Mesolithic 5.25%
Indo-Tibetan -
Mesoamerican -
Arctic-Amerind 0.85%
South-America_Amerind -
Indian 1.13%
North-Siberean -
Atlantic_Mediterranean_Neolithic 31.40%
Samoedic 0.87%
Indo-Iranian 2.01%
East-Siberean -
North-East-European 48.49%
South-African -
North-Amerind -
Sub-Saharian -
East-South-Asian -
Near_East 3.58%
Melanesian -
Paleo-Siberian -
Austronesian -
MDLP World
Population
Caucaus_Parsia 8.77%
Middle_East 4.55%
Indian 1.53%
South_and_West_European 43.19%
Melanesian -
Sub_Saharian -
North_and_East_European 40.83%
Arctic_Amerind 0.76%
East_Asian -
Paleo_African 0.06%
Mesoamerican -
North_Asian 0.31%
Dodecad World9
Population
Amerindian 1.33%
East_Asian -
African -
Atlantic_Baltic 72.95%
Australasian -
Siberian 1.35%
Caucasus_Gedrosia 12.19%
Southern 11.60%
South_Asian 0.57%
HarrapaWorld
Population
S-Indian -
Baloch 9.14%
Caucasian 7.15%
NE-Euro 51.62%
SE-Asian -
Siberian 1.24%
NE-Asian -
Papuan -
American 0.63%
Beringian 0.09%
Mediterranean 28.64%
SW-Asian 1.46%
San -
E-African -
Pygmy -
W-African -
So, those NA percentages are consistently there, but are also at very low levels. Around 1%. Noise level. No idea where they are coming from.
Yvette Hoitink, a genealogist from the Netherlands, took the Eurogenes K13 ethnicity test and discovered she had 1.15% NA, although, unlike me, she simply dismissed it out of hand, as it seemed to come from her father who descended from a long line of Dutch who never left their community. Yvette figured it was proof that these ethnicity tests are not exact, and should be taken with a grain of salt. Maybe I should just drop this whole inquiry and just consider it noise.
© 2014 Copyright, Christine Manczuk, All Rights Reserved.
The following is my father's predicted ethnicity percentages (with ranges) from AncestryDNA (Ancestry.com's DNA). I have included only those populations that either has definite DNA affinity with, or may have trace affinity with.
NOTE: Ancestry explains Trace Regions this way: "These are regions where you seem to have just a trace amount of genetic ethnicity -- there is only a small amount of evidence supporting the regions as part of your genetic ethnicity. Because both the estimated amount and the range of the estimate are small, it is possible that these regions appear by chance and are not actually part of your genetic ethnicity." [emphasis mine]
Region Approximate amount
America less than 1%
Native American less than 1% (Range: 0%-1%)
Asia 0%
Asia South 0% (Range: 0%-1%)
Europe 99%
Great Britain 62% (Range: 38%-85%)
Scandinavia 33% (Range: 12%-53%)
Ireland 2% (Range: 0%-10%)
Europe West 2% (Range: 0%-9%)
Europe East 0% (Range: 0%-2%)
European Jewish 0% (Range: 0%-less than 1%)
Finland/NWRussia 0% (Range: 0%-1%)
West Asia 0%
Middle East 0% (Range: 0%-1%)
Caucasus 0% (Range: 0%-less than 1%)
So far, so good. All of the predicted ethnicities seemed reasonable from what I knew, except the Native American. My own results included Native American 0% (Range: 0%-less than 1%). I was to find that most of my NA amounts in other ethnicity admixture tests on GEDmatch would show about half whatever my father's NA amounts were.
Here are the results from the various GEDmatch tests. I will highlight any Native American as well as Siberian and Oceanian, as they may (or may not) be relevant.
Eurogenes EUtest V2 K15
Population
North_Sea 36.44%
Atlantic 24.37%
Baltic 11.87%
Eastern_Euro 12.45%
West_Med 8.01%
West_Asian 4.52%
East_Med 0.08%
Red_Sea -
South_Asian -
Southeast_Asian -
Siberian 0.67%
Amerindian 0.81%
Oceanian 0.43%
Northeast_African -
Sub-Saharan 0.35%
Eurogenes Hunter Gatherer vs Farmer
Population
Anatolian Farmer 9.59%
Baltic Hunter Gatherer 57.12%
Middle Eastern Herder -
East Asian Farmer -
South American Hunter Gatherer 1.33%
South Asian Hunter Gatherer 0.90%
North Eurasian Hunter Gatherer 0.57%
East African Pastoralist -
Oceanian Hunter Gatherer 0.11%
Mediterranean Farmer 30.05%
Pygmy Hunter Gatherer -
Bantu Farmer 0.33%
Eurogenes K9
Population
South Asian 0.65%
Caucasus 7.00%
Southwest Asian -
North Amerindian + Arctic 1.30%
Siberian 0.85%
Mediterranean 23.72%
East Asian -
West African 0.17%
North European 66.31%
Eurogenes K10
Population
South Asian 0.57%
Caucasus 7.17%
Southwest Asian -
North Amerindian + Arctic 1.27%
Siberian 0.71%
Mediterranean 13.00%
East Asian -
West African 0.15%
East European 24.69%
North Atlantic 52.44%
Eurogenes K11
Population
South Asian 0.30%
Caucasus 6.35%
Southwest Asian -
North Amerindian + Arctic 1.19%
Siberian -
Mediterranean 12.31%
East Asian -
West African 0.11%
Volga-Ural 12.79%
South Baltic 16.45%
North Atlantic 50.49%
Eurogenes K12
Population
South Asian 0.22%
Caucasus 5.97%
Southwest Asian -
North Amerindian + Arctic 1.18%
Siberian -
Mediterranean 10.96%
East Asian -
West African 0.09%
Volga-Ural 11.35%
South Baltic 13.03%
Western European 27.18%
North Sea 30.02%
Eurogenes K13
Population
North_Atlantic 44.91%
Baltic 28.77%
West_Med 12.34%
West_Asian 6.86%
East_Med 3.16%
Red_Sea 0.05%
South_Asian 0.33%
East_Asian -
Siberian 1.33%
Amerindian 1.08%
Oceanian 0.67%
Northeast_African -
Sub-Saharan 0.49%
MDLP Ancient Roots K18
Population
Caucasian 6.66%
Melano-Austronesian 0.23%
Volga-Uralic 6.27%
East_Siberian -
West_Siberian 2.13%
South_Central_Asian 4.20%
South_Indian 0.70%
North_West_European 33.43%
Sami-Finnic 2.47%
South_East_Asian -
Archaic_African 0.61%
Mediterranean 8.21%
Arctic -
Afroasiatic 1.78%
East_European 30.29%
Roma 1.51%
East_African -
Amerindian 1.54%
MDLP World-22
Population
Pygmy -
West-Asian 6.41%
North-European-Mesolithic 5.25%
Indo-Tibetan -
Mesoamerican -
Arctic-Amerind 0.85%
South-America_Amerind -
Indian 1.13%
North-Siberean -
Atlantic_Mediterranean_Neolithic 31.40%
Samoedic 0.87%
Indo-Iranian 2.01%
East-Siberean -
North-East-European 48.49%
South-African -
North-Amerind -
Sub-Saharian -
East-South-Asian -
Near_East 3.58%
Melanesian -
Paleo-Siberian -
Austronesian -
MDLP World
Population
Caucaus_Parsia 8.77%
Middle_East 4.55%
Indian 1.53%
South_and_West_European 43.19%
Melanesian -
Sub_Saharian -
North_and_East_European 40.83%
Arctic_Amerind 0.76%
East_Asian -
Paleo_African 0.06%
Mesoamerican -
North_Asian 0.31%
Dodecad World9
Population
Amerindian 1.33%
East_Asian -
African -
Atlantic_Baltic 72.95%
Australasian -
Siberian 1.35%
Caucasus_Gedrosia 12.19%
Southern 11.60%
South_Asian 0.57%
HarrapaWorld
Population
S-Indian -
Baloch 9.14%
Caucasian 7.15%
NE-Euro 51.62%
SE-Asian -
Siberian 1.24%
NE-Asian -
Papuan -
American 0.63%
Beringian 0.09%
Mediterranean 28.64%
SW-Asian 1.46%
San -
E-African -
Pygmy -
W-African -
So, those NA percentages are consistently there, but are also at very low levels. Around 1%. Noise level. No idea where they are coming from.
Yvette Hoitink, a genealogist from the Netherlands, took the Eurogenes K13 ethnicity test and discovered she had 1.15% NA, although, unlike me, she simply dismissed it out of hand, as it seemed to come from her father who descended from a long line of Dutch who never left their community. Yvette figured it was proof that these ethnicity tests are not exact, and should be taken with a grain of salt. Maybe I should just drop this whole inquiry and just consider it noise.
© 2014 Copyright, Christine Manczuk, All Rights Reserved.
Thursday, April 6, 2017
Updated myOrigins at FTDNA
 |
| My mother's update. Looks about right based on what I know about her background. This estimate has West Middle East instead of Caucasus, as AncestryDNA predicts. |
 |
| My dad lost his curious Ashkenazi and got minor Native American. I still don't know why or who this is reflecting, but he keeps getting Native American in almost every ethnicity estimate, albeit in vanishingly small amounts. He has known German ancestors, but I think they are being reflected by the British Isles and Southeast Europe instead of West and Central Europe. Otherwise the estimate falls into line with what I know about his ancestry. |
 |
| My own update. The British Isles and Scandinavia are about what I'd expect. I just didn't get my mom's Iberian Peninsula, instead I have Southeast Europe and East Europe, and also South Central Asia (as opposed to Middle Eastern/Caucasus as my mom gets). Also Finland, which neither of my parents got. No super small Native American, as my Dad keeps getting. |
My parents and my myOrigins updated ethnicity results are a lot like our Ancestry ethnicity estimates now.
Our overall ethnicity estimates as they were in 2015, using AncestryDNA, Eurogenes K13 at GEDmatch, FTDNA, and DNA.LAND,
© 2017 Copyright, Christine Manczuk, All Rights Reserved.
Thursday, April 12, 2018
Updated 23andMe Ethnicity Estimates for Me and My Immediate Family
 |
| Sorry about the blurry words, I struggled to get reasonable screen captures, but the map shows the general idea. Here is my estimate: British and Irish (United Kingdom) is 50.1 percent; Scandinavian (Norway) is 19.5 percent; French and German (Germany) is 8.3 percent; Eastern European is 1.2 percent; Finnish is 0.2 percent; Ashkenazi Jewish is 0.1 percent; Broadly Northwestern European is 19.0 percent; and Broadly European is 1.5 percent. |
I feel more comfortable with these 23andMe ethnicity estimates than the previous ones. I'll never know exactly where my ancestors were from, but this seems to closely follow what I find in the paper trail.
One thing I noticed was that it assigned Norway to my father and I, as I would expect (my dad's grandparents were from Norway), but my mom's Scandinavian was further refined to Denmark. Also, her "French and German" was further refined to Netherlands (she has known Netherlands, albeit quite a ways back, but she also does have German and likely French).
Steve's AncestryDNA pointed to a tiny amount of Nigerian, so the West African blip in the 23andMe makes me think that it might actually be real. Some in his Murphy line have claimed Native American ancestry, but I think I've seen white people who sometimes claim Native American ancestry have African ancestry instead. Maybe that is the case in this instance.
 |
| My mother's updated 23andMe estimate: British and Irish (United Kingdom) is 61.4 percent; French and German (Netherlands) is 13.8 percent; Scandinavian (Denmark) is 2.6 percent; Broadly Northwestern European is 19.4 percent; Broadly Southern European is 0.9 percent; and Broadly European is 1.8 percent. |
 |
| My Dad's updated ethnicity results: Scandinavian (Norway) is 42.2 percent; British and Irish (United Kingdom) is 19.2 percent; French and Germany (Germany) is 1.9 percent; Balkan is 0.5 percent; Finnish is 0.2 percent; Ashkenazi Jewish is 0.1 percent; Broadly Northwestern European is 30.8 percent; Broadly Southern European is 1.1 percent; and Broadly European is 3.8 percent. |
 |
| My husband's updated ethnicity results: Eastern European (Poland) is 30.8 percent; French and Germany (Germany) is 12.7 percent; British and Irish (United Kingdom) is 4.4 percent; Balkan is 0.7 percent, Finnish is 0.7 percent; Iberian is 0.7 percent; Ashkenazi Jewish is 0.3 percent; Broadly Northwestern European is 22 percent; Broadly Southern European is 2.5 percent; Broadly European is 16.1 percent. East Asian and Native American (Broadly East Asian) is 0.1 percent; and Sub-Saharan African (West African) is 0.1 percent. |
© 2018 Copyright, Christine Manczuk, All Rights Reserved.
Saturday, October 20, 2018
Too Funny: Elizabeth Warren's DNA Test
 |
| Comic from Dana Summers. |
Welcome to the noise-level Native American DNA club, Elizabeth Warren! My father gets a consistently tiny reading in most ethnicity calculators of Native American/Amerindian, and if real (which is unlikely) it is due to an ancestor from the 1700s. Although it seems that the ethnicity estimates seem to point to some Arctic origin, possibly Greenland or Siberia, and possibly Saami.
These DNA tests are quite something. pic.twitter.com/tCHmW7pJbj— Senator Hatch Office (@senorrinhatch) October 15, 2018
© 2018 Copyright, Christine Manczuk, All Rights Reserved.
Tuesday, April 7, 2015
What's the Same, What is Different? My Dad's DNA Ethnicity Estimates
 |
| AncestryDNA |
 |
| FTDNA |
 |
| Eurogenes K13 |
 |
| Eurogenes EUtest V2 K15 |
 |
| Eurogenes K9 |
 |
| Eurogenes JTest |
 |
| Dodecad World9 |
 |
| Dodecad V3 |
FTDNA estimates about 6% Ashkenazi Jewish, a result I don't think I'm seeing in the other ethnicity estimates. FTDNA centers that population in Poland. The only known Polish ancestor I have is Solomon Joseph Hartley, who I thought was probably of Dutch Mennonite extraction, but who knows, maybe he was also Jewish? Solomon Joseph is not unheard of in English/Anglo naming, but it seems much more prevalent in Jewish names. Just something to think about. I've discussed Solomon in the past here, here, and here.
All the tests that include Native American as a possible group have my dad with some small (~1%) amount. The most overt NA I've seen is in his World9 Oracle:
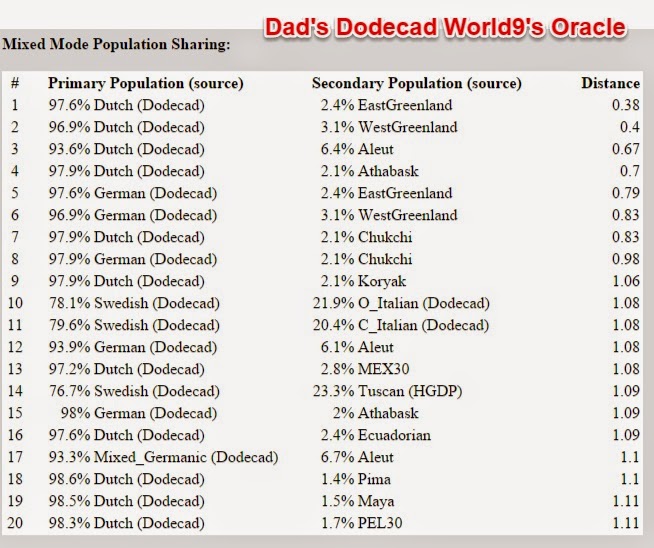
East Greenland? But why? We have neither story or paper trail evidence of this. I seem to be in the same confusion boat as the decidedly Dutch genealogist and blogger Yvette Hoitink, as she wrote in her post "My Native American DNA. Say what?" Or as The Legal Genealogist blogger Judy Russell's say: "Admixture: not soup yet."
I used Evernote for the screenshots.
© 2015 Copyright, Christine Manczuk, All Rights Reserved.
Monday, October 6, 2014
Mappy Monday: A Few Resources for County Boundary Changes
Geography and maps are an integral part of genealogy. My own huge colonial American ancestry makes understanding British and American political boundaries necessary, in particular county boundaries and how they have changed over time.
My first exposure to a work dedicated to county boundary changes in the United States was William Dollarhide's classic Map Guide to the U.S. Federal Censuses, 1790-1920.

Created primarily to use in conjunction with each of the federal censuses during that time period, this book is great for anyone wishing to visualize the growth of the United States and the individual counties. Knowing where your ancestors lived helps you locate additional information about them, and oftentimes you can locate records about a place in 2 different counties, either because one county was shaved off a larger "parent" county, or because of their past or present proximity to each other.
The maps in this book show at a glance why your ancestors could stay in the same place over time and yet change counties. It also shows how it would be impossible for your 4th great grandfather to have been born in Sac County, Iowa in 1790, as that county (and state) hadn't been created yet. Well, they may have been born at the exact present location of Sac County, Iowa if they were Native American or possibly French, but then it would have been called something else.
Is the date range from 1790-1920 too limited for your research?
The MAPofUS Historical Atlases and Maps of U.S. and States is an online source of maps that includes not only the US maps from 1790-1920, but also includes British colonial boundaries in America. Each state has "rotating animated maps" that can go back to the 1600's in the eastern states like Virginia. There is also a selection of David Rumsey maps for each state.
© 2014 Copyright, Christine Manczuk, All Rights Reserved.
My first exposure to a work dedicated to county boundary changes in the United States was William Dollarhide's classic Map Guide to the U.S. Federal Censuses, 1790-1920.
[cover as seen on Amazon.com's page]
Created primarily to use in conjunction with each of the federal censuses during that time period, this book is great for anyone wishing to visualize the growth of the United States and the individual counties. Knowing where your ancestors lived helps you locate additional information about them, and oftentimes you can locate records about a place in 2 different counties, either because one county was shaved off a larger "parent" county, or because of their past or present proximity to each other.
The maps in this book show at a glance why your ancestors could stay in the same place over time and yet change counties. It also shows how it would be impossible for your 4th great grandfather to have been born in Sac County, Iowa in 1790, as that county (and state) hadn't been created yet. Well, they may have been born at the exact present location of Sac County, Iowa if they were Native American or possibly French, but then it would have been called something else.
Is the date range from 1790-1920 too limited for your research?
The MAPofUS Historical Atlases and Maps of U.S. and States is an online source of maps that includes not only the US maps from 1790-1920, but also includes British colonial boundaries in America. Each state has "rotating animated maps" that can go back to the 1600's in the eastern states like Virginia. There is also a selection of David Rumsey maps for each state.
© 2014 Copyright, Christine Manczuk, All Rights Reserved.
Tuesday, October 20, 2015
DNA.LAND Results In!

Since this is an American database, and my mom has much deeper American colonial ancestry, she has always had about twice as many DNA matches as my father, whose maternal lines are all from Scandinavia. As expected, my mom has the first matches, to what is likely a man and his mother (or possibly aunt), based on the names and email given (which I've blanked out):
 |
| Mom's matches so far. |
A detailed look at the right side shows recent and ancient shared segments. At this point you can't click on any of the chart for more information, including the exact location of the matches, but again, this is a brand-new site:

ETA: the [Show/Hide Table] DOES show where the matches are, my mistake!
Dad doesn't have any relative matches yet.
DNA.LAND is using Dr. Joe Pickrell's Ancestry program for the ethnicity estimates. According to the FAQs on DNA.LAND:
Ancestry detection is an experimental feature and we are currently working to improve it, including a feedback page so that users can provide input to help us improve the algorithm.
I will show the ethnicity estimates for my parents using results from AncestryDNA, Eurogenes K13 on GEDmatch (I think a good standard test for people of mostly or all European ancestry), FamilyTreeDNA, and DNA.LAND.
 |
| Mom's AncestryDNA estimate |
 |
| Mom's Eurogenes K13 (from GEDmatch) |
 |
| Mom's FamilyTreeDNA estimate |
 |
| Mom's DNA.LAND ethnicity estimate. This is way less specific than the others. |
My dad is half Scandinavian, and about 1/4 English and 1/4 German (according to his paper trail). He has had some surprises in his estimates--either about 1% Native American (AncestryDNA and Eurogenes K13) or about 6% Ashkenazi Jewish (FamilyTreeDNA and DNA.LAND). Like Superman and Clark Kent, those two ethnicities never show up together in one test. I cannot account for either of these ethnicities in his paper trail, so I am curious what his 1.22% other is in DNA.LAND.
I'm guessing that it is likely South Asian, as DNA.LAND seems similar to FamilyTreeDNA.
 |
| Dad's AncestryDNA |
 |
| Dad's Eurogenes K13 |
 |
| Dad's FamilyTreeDNA estimate |
 |
| Dad's DNA.LAND estimate |
So far so good for a new site. I look forward to what DNA.LAND will turn into.
© 2015 Copyright, Christine Manczuk, All Rights Reserved.
Wednesday, June 7, 2017
Gone for Soldiers: Lyman Worden (1790 - 1883) Soldier
Several months ago I posted about Lyman Worden's 1880 interview by a local newspaperman and promised to look into what this maternal 4X great grandfather did during his three-month service during the War of 1812. Today's the day I fulfill that commitment.
In 1813 Lyman and his young family were living in Cayuga County when he was called into service with the New York militia.

Here's a contemporary view of Fort Niagara from the British side of the river where Lyman's company camped for a week.

And here's Fort George (from the American side) where his company spent an undisclosed amount of time but it couldn't have been very long as his whole time in the militia lasted no more than three months.

And here's a portrait of the American General George McClure mentioned in Lyman's interview.

You can find more information about Fort George here and here; read about the events of the War of 1812 on the Niagara River here; and learn about the Native American involvement during the war here
© 2017 Copyright, Christine Manczuk, All Rights Reserved.
In 1813 Lyman and his young family were living in Cayuga County when he was called into service with the New York militia.

Source: NYS Historic Newspapers, Image provided by: SUNY Oswego]
Here's a contemporary view of Fort Niagara from the British side of the river where Lyman's company camped for a week.

[Fort Niagara taken from the British side of the river at Newark. William Strickland, 1787-1854, engraver. Published - Philadelphia, 1814 Oct.
Source: Library of Congress]
And here's Fort George (from the American side) where his company spent an undisclosed amount of time but it couldn't have been very long as his whole time in the militia lasted no more than three months.

[View of British Fort George from U.S. Fort Niagara, c.1811 (LAC)]
And here's a portrait of the American General George McClure mentioned in Lyman's interview.

You can find more information about Fort George here and here; read about the events of the War of 1812 on the Niagara River here; and learn about the Native American involvement during the war here
© 2017 Copyright, Christine Manczuk, All Rights Reserved.
Monday, May 30, 2016
Memento Mori: Memorial Day
My original intent for today was to re-post last year's Memorial Day tribute; next I thought I might highlight those individuals (most, but not all of them, my direct ancestors) whom I've posted about under my Gone for Soldiers label.
Then I recalled this photo of the air crew with my maternal uncle Jack Slater's notes written on the back. I don't know where it was taken, but assume that it must have been during his training as a B-17 pilot in the Army Air Corps. Not only does Jack list himself as the pilot here--and he was co-pilot on his three missions in Europe*--but close inspection of the lettering on the object to the left of the group reveals it to be a practice bomb.


[All courtesy of Olive Slater-Kennedy]
Here's my transcription of Jack's notes above:
Here we are, Crew 21 of the Bartholmess** Provisional Group. We are a typical combat crew - typical in that we represent all sections and elements of the country, in that we consider ourselves the best of the lot. We are the All American team of this or any other war year. We shall carry the war to the enemy, and hit him hard. Pardon me, if I sound like the proud parent, telling of his very ordinary children. We are, starting with the front row, reading left to right:Based on the information Jack has put in his notes, I was able to trace all of his fellow crew members except William R. Jones. Only Jack and Vito DiSabato didn't survive the war.
1. Pilot - You know me; I shan't describe myself.
2. Co-Pilot - Lt. Charles M. Guyler is at present newly-married. His wife, also from Pennsylvania, calls him "Chub". He is a level-headed, likeable young man of 25, an excellent pilot. I'd be lost without him.
3. Navigator - Lt. William R. Jones is the senior member at 33. A native Texan, he washed out as a pilot, and is the best Navigator in the group. Also married.
4. Bombardier - Lt. Jack L. Kipnis is at 26 still rather boyish. A Jewish boy from Brooklyn, he is a typical devil-may-care, efficient bombardier. Outwardly he seems to know only bombing and women.
5. Engineer - St Sgt Jackson G. Osborne has a mechanic's tasks. The boys call him "Bulldog", because of his noisy, husky egotism. He'd run the plane (and crew) if we'd let him. West Virginia (20).
6. Assistant Engineer - Sgt. Vito W. DiSabato is a native-born Italian with Latin good looks and personality. Lately from New York, he is also a waist gunner. He is 21.
7. Radio Operator - Sgt. Lowell T. Birdwell at 23 has been in the Army for 3 years. He has served in his native Texas and the Caribean [sic]. He is the "character" of the crew, very droll.8. Asst. Radio Operator - Allan V. Kangas is the baby at 19. Typically Scandinavian and a native born Finn. Very quiet. The Boys call him "Smiley" as he has no front teeth.
9. Cpl. Robert L. Lane is the Armorer - Ball turret gunner. He is 21, typically New England, the best gunner on the crew. Why the boys call him "Rabbit" I can't say. They also call him Jr. because he looks so young.
10. The tail gunner is Sgt. Ralph E. Martinez of Texas. Another quiet boy, well liked by us all. "Rocky" is also 21. Another excellent gunner.
- Charles Miller Guyler (1918-1991)
- Jack L. Kipnis (1917-1978)
- Jackson G. Osborne (1923-1981)
- Vito W. DiSabato (1921-1944)
- Lowell T. Birdwell (1919-1995)
- Allan V. Kangas (1924-1994)
- Robert L. Lane (1922-2111)
- Ralph E.Martinez (1922-1981)
Thanks to the internet and YouTube I was able to locate several of the training films that Jack would have seen during his training.
[How to fly the B-17: Ground Operations
1943 US Army Air Forces Training Film World War II]
[How To Fly The B-17: Flight Operations
1943 US Army Air Forces Training Film World War II]
29 Nov 1843 Bremen link here plane name unknown 42-31171
30 Nov 1943 Solengin link here Mayfly 42-3356
5 Dec 1943 Bordeaux/Merignac link here Fighting Cock 42-3397
**I believe this refers to Lt. Col. Karl T. Barthelmess.
© 2016 Copyright, Christine Manczuk, All Rights Reserved.
Thursday, December 8, 2016
Fantastic Find: United States Digital Map Library
The United States Digital Map Library is a project of USGenWeb Archives which describes itself thus:

However what I find of particular interest is their collection of maps of Indian land cessions "during the interval between the formal establishment of the United States and 1894." Here's a map of California:

They also provide links to the texts to the 375 Native American Treaties recognized by the Department of State.
© 2016 Copyright, Christine Manczuk, All Rights Reserved.
Our goal is to make available to genealogists, useful, readable, high quality maps. Here you will find both archival maps and newly made maps based on scholarly research. This project and all of its strictly volunteer staff are dedicated to free, online access for the general public.Here the researcher can find U.S. and state and county maps (which comprise the bulk of their collection). Here's a 1900 map of California roads for cyclers:

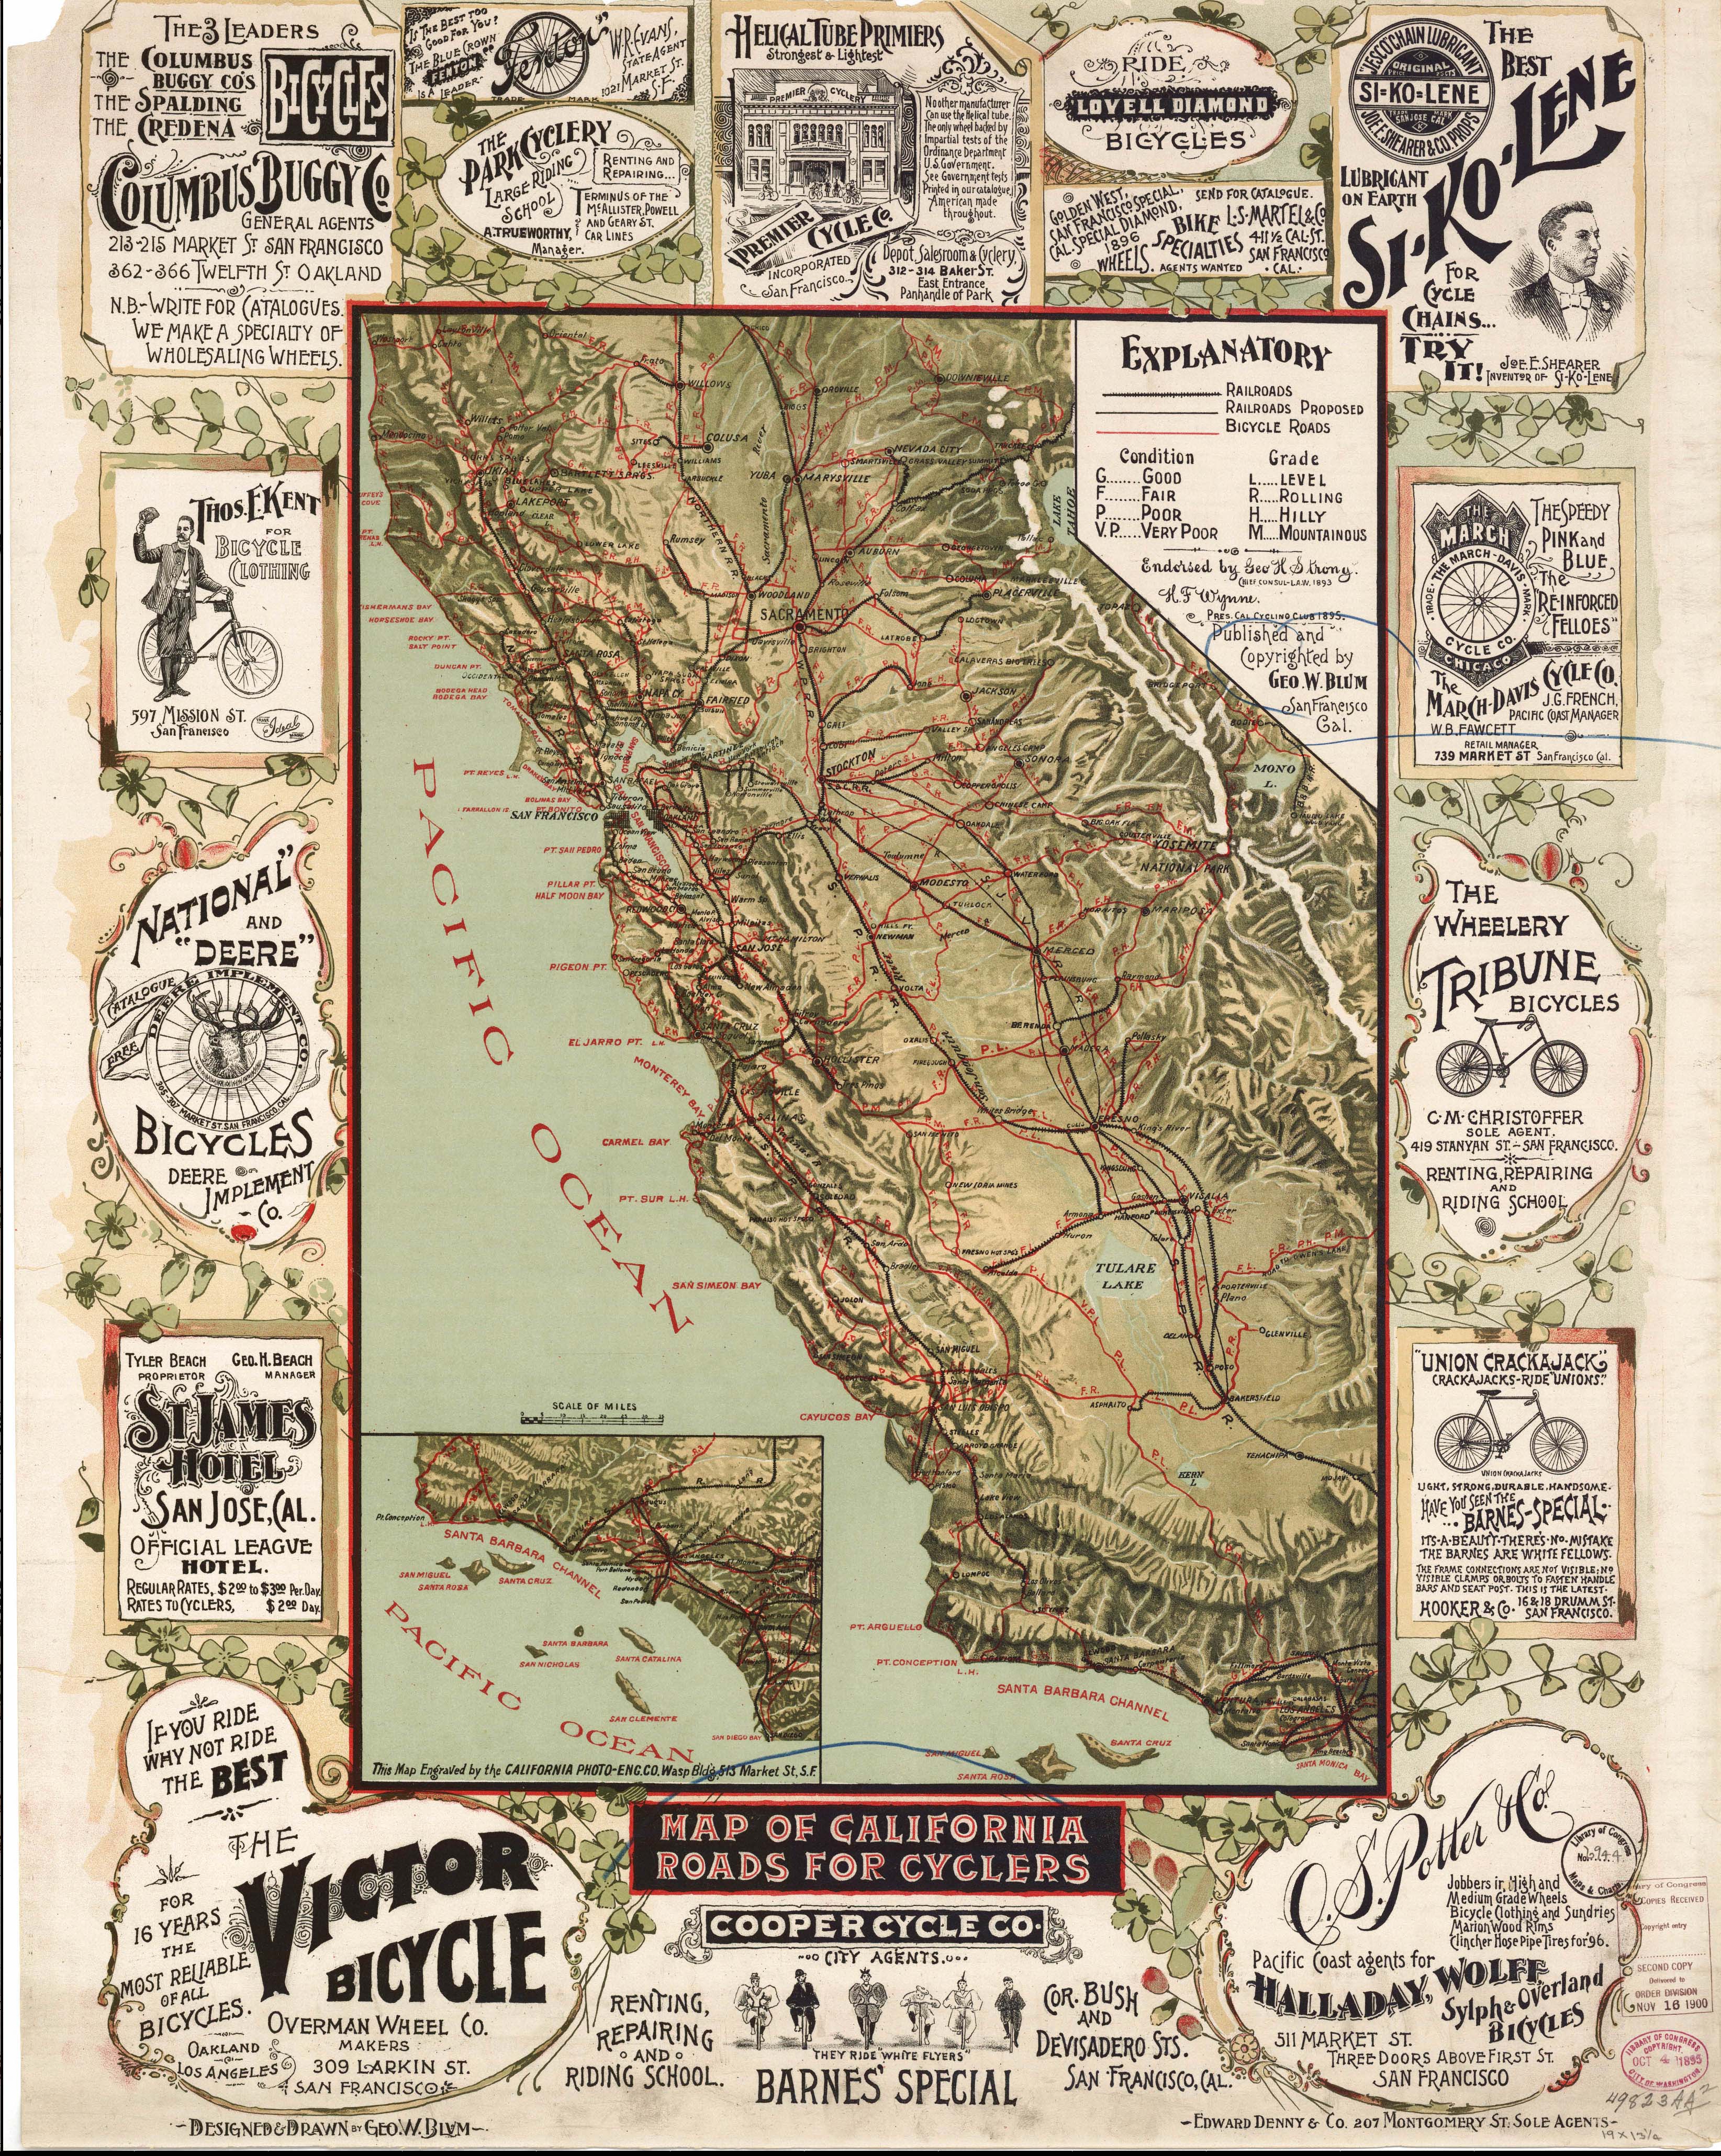
However what I find of particular interest is their collection of maps of Indian land cessions "during the interval between the formal establishment of the United States and 1894." Here's a map of California:

[Map 7, California from Indian Land Cessions in the United States, compiled by Charles C. Royce and presented as Part 2 of the Eighteenth Annual Report of the Bureau of American Ethnology to the Secretary of the Smithsonian Institution, 1896-97. The Report was printed by the Government Printing Office in 1899]
They also provide links to the texts to the 375 Native American Treaties recognized by the Department of State.
© 2016 Copyright, Christine Manczuk, All Rights Reserved.
Friday, August 31, 2018
Family Friday: Ashtabula Lyle (1857 - 1937) & Her Husband Seth P. Thomas (1853 - 1940)
I don't know why this second cousin, three times removed*, was named Ashtabula, the name of a city and county located on Lake Erie, far to the north of her birthplace in downstate in Meigs County, Ohio. Perhaps her parents just liked how this Native-American-derived word sounded.**

Ashtabula and Seth were married in Gallia County, Ohio, in 1885 and seem to have lived in that county for their entire lives. They had four children.

[Ancestry.com. Ohio, County Marriage Records, 1774-1993 [database on-line]. Lehi, UT, USA: Ancestry.com Operations, Inc., 2016. Original data: Marriage Records. Ohio Marriages. Various Ohio County Courthouses.]

Both of these portraits were found on the Ancestry.com family tree of VickieHill56 who doesn't appear to be a DNA match of mine.
*This is how we're related through my Webb lineage:

[Ancestry.com]
**Here's how Wikipedia translates it: The name Ashtabula is derived from ashtepihəle, which means 'always enough fish to be shared around' in the Lenape language
© 2018 Copyright, Christine Manczuk, All Rights Reserved.
Tuesday, November 10, 2015
New Admixture Test on GEDmatch: PuntDNAL K15

I have seen PuntDNAL for a while, but it seemed to be tailored for those of mostly African ancestry so it didn't seem relevant to my research, but I came across this new one last week. I ran my parents and me through the calculator, and I am a bit unsure what to make of the results. I'd say Eurogenes is probably the more accurate test for us from what I know of my parents' ancestry.
The description of the test:
This calculator focuses primarily on Africa (particularly East Africa), West Asia, and Europe. If you are mostly African, West Asian, or European, then you will find it useful and Accurate. It will be periodically updated as new data becomes available. Questions and comments about this calculator should be directed to Abdullahi Warsame.
Thank you to Abdullahi for making this available!
For comparison, this is my father's AncestryDNA admixture estimate:
Native American less than 1%
Great Britain 62%
Scandinavia 33%
Ireland 2%
Europe West 2%

Admix Results (sorted):
# Population Percent
1 NE_European 55.86
2 Mediterranean 29.8
3 Caucasian 8.51
4 Beringian 1.94
5 SW_Asian 1.85
6 S_Indian 0.88
7 W_African 0.86
8 Amerindian 0.24
9 Omo_River 0.05
10 Siberian 0.01
Single Population Sharing:
# Population (source) Distance
1 English 2.39
2 Orcadian 2.52
3 Irish 2.99
4 Scottish 3.28
5 North_German 3.67
6 Utahn_White 4.11
7 Norwegian 4.43
8 Austrian 4.54
9 South_German 4.58
10 Slovenian 4.88
11 Hungarian 5.17
12 Croatian 6.28
13 Swedish 6.88
14 French 7.82
15 Serbian 9.61
16 Polish 10.24
17 Bosnian 14.19
18 Macedonian 15.2
19 Romanian 16.25
20 Belarusian 16.72
Mixed Mode Population Sharing:
# Primary Population (source) Secondary Population (source) Distance
1 96.9% English + 3.1% West_Greenlander @ 0.95
2 98.1% English + 1.9% East_Greenlander @ 0.97
3 98.1% Orcadian + 1.9% East_Greenlander @ 1.39
4 97% Orcadian + 3% West_Greenlander @ 1.44
5 97.6% Scottish + 2.4% East_Greenlander @ 1.73
6 96.2% Scottish + 3.8% West_Greenlander @ 1.9
7 98.3% English + 1.7% Koryak @ 1.99
8 98.6% English + 1.4% African_American @ 2.01
9 98.8% English + 1.2% Igbo @ 2.02
10 98.7% English + 1.3% Bamoun @ 2.02
11 98.8% English + 1.2% Bambaran @ 2.02
12 98.8% English + 1.2% Hausa @ 2.02
13 98.8% English + 1.2% Brong @ 2.02
14 98.7% English + 1.3% NE_Bantu @ 2.02
15 98.8% English + 1.2% Mandinka @ 2.03
16 51% Norwegian + 49% South_German @ 2.03
17 98.6% English + 1.4% Luhya @ 2.03
18 98.9% English + 1.1% Yoruban @ 2.03
19 98.7% English + 1.3% SA_Bantu @ 2.03
20 98.6% English + 1.4% Xhosa @ 2.04
Admix Results (sorted):
# Population Percent
1 NE_European 55.86
2 Mediterranean 29.80
3 Caucasian 8.51
4 Beringian 1.94
5 SW_Asian 1.85
Finished reading population data. 157 populations found.
15 components mode.
--------------------------------
Least-squares method.
Using 1 population approximation:
1 English @ 2.276304
2 Orcadian @ 2.459624
3 Irish @ 3.017227
4 Scottish @ 3.364615
5 North_German @ 3.864859
6 Utahn_White @ 4.328273
7 Austrian @ 4.772326
8 Norwegian @ 4.782928
9 South_German @ 4.904590
10 Slovenian @ 5.199419
11 Hungarian @ 5.541170
12 Croatian @ 6.847998
13 Swedish @ 7.499986
14 French @ 8.523516
15 Serbian @ 10.631078
16 Polish @ 11.224601
17 Bosnian @ 15.741078
18 Macedonian @ 16.862701
19 Romanian @ 18.006475
20 Russian @ 18.122931
Using 2 populations approximation:
1 50% Norwegian +50% South_German @ 1.913835
Using 3 populations approximation:
1 50% Norwegian +25% Irish +25% French @ 1.906923
Using 4 populations approximation:
1 Norwegian + Norwegian + Irish + French @ 1.906923
2 Norwegian + Norwegian + South_German + South_German @ 1.913835
3 Norwegian + North_German + Orcadian + French @ 1.932284
4 Polish + Norwegian + French + French @ 1.936818
5 Norwegian + North_German + English + French @ 1.954294
6 Norwegian + Norwegian + Utahn_White + South_German @ 1.964432
7 Norwegian + North_German + South_German + South_German @ 1.972860
8 Norwegian + North_German + Irish + French @ 1.987115
9 Swedish + Norwegian + South_German + French @ 1.990007
10 Norwegian + Norwegian + Orcadian + French @ 1.991178
11 Norwegian + North_German + Utahn_White + South_German @ 1.992937
12 Norwegian + Norwegian + Hungarian + French @ 1.998845
13 Norwegian + Norwegian + Austrian + French @ 2.004083
14 Norwegian + North_German + North_German + French @ 2.004564
15 Polish + Swedish + French + French @ 2.007750
16 Belarusian + English + French + French @ 2.008666
17 Norwegian + Norwegian + Slovenian + French @ 2.008670
18 Polish + North_German + South_German + French @ 2.012599
19 Norwegian + Scottish + Slovenian + French @ 2.013311
20 Norwegian + Norwegian + English + French @ 2.014159
For comparison, this is my mother's AncestryDNA admixture estimate:
Great Britain 65%
Iberian Peninsula 10%
Europe West 8%
Ireland 7%
Scandinavia 7%
Caucasus 3%

Admix Results (sorted):
# Population Percent
1 NE_European 52.29
2 Mediterranean 30.92
3 Caucasian 10.74
4 SW_Asian 2.34
5 S_Indian 1.06
6 Omo_River 0.92
7 Beringian 0.8
8 Horn_Of_Africa 0.52
9 Amerindian 0.17
10 Oceanian 0.14
11 S_African 0.08
12 Wht_Nile_River 0.02
Single Population Sharing:
# Population (source) Distance
1 South_German 2.05
2 Utahn_White 2.33
3 Irish 4.3
4 English 4.53
5 French 4.72
6 Croatian 4.83
7 Orcadian 5
8 Hungarian 5.22
9 Austrian 5.45
10 Serbian 5.79
11 Slovenian 5.82
12 Scottish 6.26
13 North_German 6.59
14 Norwegian 7.95
15 Swedish 10.34
16 Bosnian 10.51
17 Macedonian 11.23
18 Romanian 12.26
19 Bulgarian 12.98
20 Polish 13.6
Mixed Mode Population Sharing:
# Primary Population (source) Secondary Population (source) Distance
1 55.5% French + 44.5% Slovenian @ 1.15
2 73.7% South_German + 26.3% Croatian @ 1.18
3 52.7% French + 47.3% Hungarian @ 1.24
4 72% North_German + 28% Italian @ 1.32
5 72.1% English + 27.9% Macedonian @ 1.35
6 67.9% Scottish + 32.1% Bulgarian @ 1.36
7 75.4% Norwegian + 24.6% Tuscan @ 1.36
8 96.1% Utahn_White + 3.9% Tadjik @ 1.4
9 77.1% South_German + 22.9% Hungarian @ 1.4
10 75% English + 25% Bulgarian @ 1.41
11 64.6% Scottish + 35.4% Macedonian @ 1.42
12 92.6% English + 7.4% Assyrian @ 1.44
13 85.1% English + 14.9% Greek_Central @ 1.45
14 60.9% Norwegian + 39.1% Romanian @ 1.46
15 97.3% Utahn_White + 2.7% Makrani @ 1.46
16 91.6% English + 8.4% Turk_Kayseri @ 1.47
17 83.7% English + 16.3% Greek_Thessaly @ 1.47
18 72.9% Orcadian + 27.1% Bulgarian @ 1.47
19 97.4% Utahn_White + 2.6% Brahui @ 1.47
20 66.7% Scottish + 33.3% Romanian @ 1.48
Admix Results (sorted):
# Population Percent
1 NE_European 52.29
2 Mediterranean 30.92
3 Caucasian 10.74
4 SW_Asian 2.34
5 S_Indian 1.06
Finished reading population data. 157 populations found.
15 components mode.
--------------------------------
Least-squares method.
Using 1 population approximation:
1 South_German @ 2.128099
2 Utahn_White @ 2.460671
3 Irish @ 4.703682
4 English @ 4.990640
5 French @ 5.126281
6 Croatian @ 5.222383
7 Orcadian @ 5.522955
8 Hungarian @ 5.645545
9 Austrian @ 5.921393
10 Slovenian @ 6.341358
11 Serbian @ 6.418254
12 Scottish @ 6.928301
13 North_German @ 7.258951
14 Norwegian @ 8.806544
15 Swedish @ 11.442522
16 Bosnian @ 11.654517
17 Macedonian @ 12.465020
18 Romanian @ 13.596674
19 Bulgarian @ 14.398587
20 Polish @ 15.026039
Using 2 populations approximation:
1 50% Hungarian +50% French @ 1.217426
Using 3 populations approximation:
1 50% North_German +25% French +25% Macedonian @ 1.153106
Using 4 populations approximation:
1 Orcadian + South_German + South_German + Serbian @ 0.999414
2 North_German + South_German + French + Serbian @ 1.022581
3 North_German + Utahn_White + French + Serbian @ 1.057597
4 Norwegian + North_German + French + Macedonian @ 1.069893
5 English + South_German + South_German + Serbian @ 1.084497
6 North_German + Croatian + French + French @ 1.090698
7 Irish + Croatian + French + French @ 1.102772
8 Croatian + South_German + South_German + South_German @ 1.120867
9 Irish + South_German + South_German + Serbian @ 1.121346
10 Swedish + Irish + French + Macedonian @ 1.123925
11 Slovenian + Croatian + French + French @ 1.130654
12 Orcadian + Irish + French + Serbian @ 1.131846
13 Irish + Croatian + South_German + French @ 1.132046
14 English + Irish + French + Serbian @ 1.135169
15 Slovenian + Hungarian + French + French @ 1.137533
16 North_German + South_German + South_German + Serbian @ 1.142156
17 Orcadian + Utahn_White + South_German + Serbian @ 1.142925
18 Norwegian + Irish + South_German + Romanian @ 1.144317
19 Scottish + North_German + South_German + Bulgarian @ 1.145327
20 Norwegian + South_German + French + Serbian @ 1.150340
For comparison, this is my AncestryDNA admixture estimate:
Great Britain 71%
Scandinavia 17%
Europe West 9%
Europe East less than 1%
Ireland less than 1%
Caucasus less than 1%

Admix Results (sorted):
# Population Percent
1 NE_European 53.48
2 Mediterranean 30.74
3 Caucasian 10.28
4 SW_Asian 1.5
5 Beringian 1.44
6 S_Indian 1.11
7 S_African 0.96
8 Omo_River 0.26
9 Siberian 0.1
10 Oceanian 0.08
11 Amerindian 0.06
Single Population Sharing:
# Population (source) Distance
1 Utahn_White 2.59
2 South_German 2.69
3 Irish 3.66
4 English 3.74
5 Orcadian 4.26
6 Hungarian 5.21
7 Scottish 5.29
8 Austrian 5.31
9 Croatian 5.33
10 Slovenian 5.52
11 French 5.63
12 North_German 5.68
13 Norwegian 6.94
14 Serbian 7.14
15 Swedish 9.34
16 Bosnian 11.81
17 Macedonian 12.61
18 Polish 12.67
19 Romanian 13.65
20 Bulgarian 14.36
Mixed Mode Population Sharing:
# Primary Population (source) Secondary Population (source) Distance
1 97.6% Utahn_White + 2.4% West_Greenlander @ 1.97
2 74.2% South_German + 25.8% Slovenian @ 2
3 63.2% Irish + 36.8% French @ 2.01
4 63.4% South_German + 36.6% Irish @ 2.03
5 98.6% Utahn_White + 1.4% East_Greenlander @ 2.03
6 73.4% South_German + 26.6% Hungarian @ 2.05
7 91.7% South_German + 8.3% Russian @ 2.08
8 75.6% Utahn_White + 24.4% Hungarian @ 2.08
9 92% South_German + 8% Karelian @ 2.08
10 75.7% South_German + 24.3% North_German @ 2.09
11 93.9% English + 6.1% Turk_Kayseri @ 2.1
12 94.4% English + 5.6% Turk_Istanbul @ 2.1
13 92% South_German + 8% Belarusian @ 2.13
14 76.9% Utahn_White + 23.1% Croatian @ 2.14
15 94.9% English + 5.1% Turk_Trabzon @ 2.14
16 94.6% English + 5.4% Azerbaijani @ 2.14
17 92.8% South_German + 7.2% Finnish @ 2.14
18 50.2% French + 49.8% North_German @ 2.15
19 50.6% Slovenian + 49.4% French @ 2.15
20 77.9% Utahn_White + 22.1% Slovenian @ 2.15
Admix Results (sorted):
# Population Percent
1 NE_European 53.48
2 Mediterranean 30.74
3 Caucasian 10.28
4 SW_Asian 1.50
5 Beringian 1.44
6 S_Indian 1.11
Finished reading population data. 157 populations found.
15 components mode.
--------------------------------
Least-squares method.
Using 1 population approximation:
1 Utahn_White @ 2.567060
2 South_German @ 2.729956
3 Irish @ 3.845506
4 English @ 3.982403
5 Orcadian @ 4.574748
6 Hungarian @ 5.549877
7 Austrian @ 5.658752
8 Croatian @ 5.715500
9 Scottish @ 5.735458
10 Slovenian @ 5.910424
11 French @ 6.083564
12 North_German @ 6.156975
13 Norwegian @ 7.626692
14 Serbian @ 7.838583
15 Swedish @ 10.276428
16 Bosnian @ 13.063908
17 Polish @ 13.941177
18 Macedonian @ 13.961777
19 Romanian @ 15.095651
20 Bulgarian @ 15.898861
Using 2 populations approximation:
1 50% Irish +50% South_German @ 2.045060
Using 3 populations approximation:
1 50% Scottish +25% French +25% Serbian @ 1.847615
Using 4 populations approximation:
1 Scottish + North_German + French + Serbian @ 1.779079
2 North_German + Slovenian + French + French @ 1.794362
3 Norwegian + English + French + Serbian @ 1.805328
4 Swedish + Croatian + French + French @ 1.818229
5 North_German + Croatian + South_German + French @ 1.820063
6 Irish + Slovenian + South_German + French @ 1.821359
7 Scottish + Croatian + South_German + French @ 1.822314
8 Norwegian + Irish + French + Serbian @ 1.823437
9 Norwegian + Scottish + French + Serbian @ 1.823824
10 Norwegian + Utahn_White + South_German + Serbian @ 1.824926
11 Norwegian + Croatian + South_German + French @ 1.831322
12 North_German + Utahn_White + Croatian + French @ 1.833168
13 Irish + Hungarian + Utahn_White + French @ 1.836367
14 Norwegian + Utahn_White + Utahn_White + Serbian @ 1.840035
15 Swedish + Utahn_White + French + Serbian @ 1.840461
16 Scottish + Utahn_White + Croatian + French @ 1.844574
17 Scottish + Scottish + French + Serbian @ 1.847615
18 Norwegian + Orcadian + French + Serbian @ 1.850348
19 Scottish + Hungarian + South_German + French @ 1.850951
20 Irish + Hungarian + South_German + French @ 1.852806
© 2015 Copyright, Christine Manczuk, All Rights Reserved.
Subscribe to:
Posts (Atom)